Building material prices in September 2026: rebar up 30% in a year
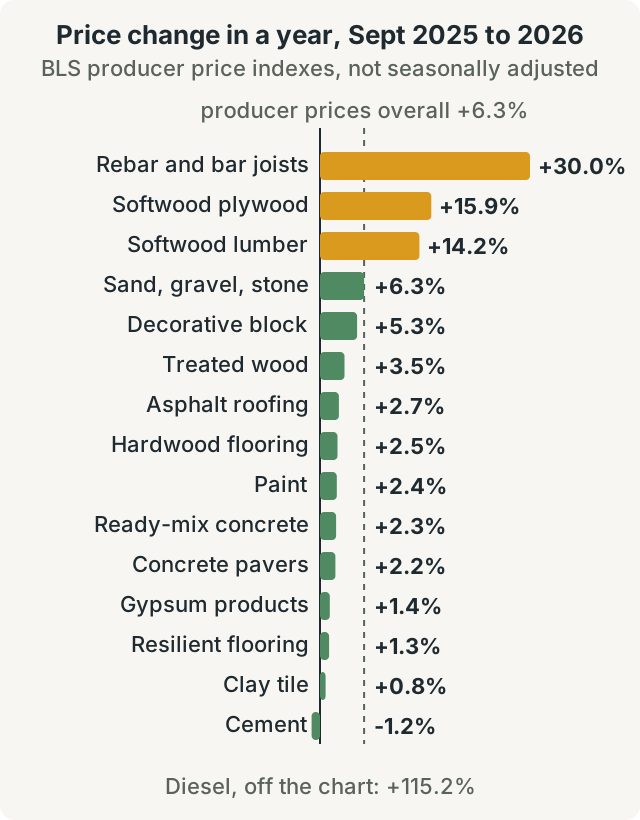
Steel and softwood are up sharply. Most other materials are rising too, just more slowly than prices overall. In the Bureau of Labor Statistics producer price index released October 15, the index that covers concrete reinforcing bar was 30.0% higher in September 2026 than a year before, and softwood lumber was up 14.2%. Set rebar, lumber and plywood aside, and only sand, gravel and stone kept pace with producer prices as a whole, which rose 6.3%. Ready-mix concrete was up 2.3%, drywall (gypsum products) 1.4% and paint 2.4%.
The producer price index, or PPI, tracks what makers get paid when they sell. Besides its broad indexes, BLS publishes many narrow ones, down to single products like ready-mix concrete or treated wood. We took the September figure for each material a ShedMath calculator counts from the raw BLS data files, and compared it with August 2026 and September 2025.
If you’ve seen a scarier number this month, it’s probably the National Association of Home Builders’ write-up of the same release, posted October 15. Its index of inputs to residential construction rose 10.3% in a year. It’s a wider basket. It counts energy (up 64.1%) and services (up 11.3%). NAHB’s building materials alone, without energy, rose 5.5%.
Each calculator’s material, September 2026
| Calculator | BLS index | Change in a month | Change in a year |
|---|---|---|---|
| Concrete, slab planner | Ready-mix concrete | 0.0% | +2.3% |
| Concrete, bagged mix | Cement | 0.0% | -1.2% |
| Rebar, slab planner | Concrete reinforcing bars and bar joists | +4.9% | +30.0% |
| Gravel, paver base | Construction sand, gravel and crushed stone | +0.2% | +6.3% |
| Paver | Concrete pavers | 0.0% | +2.2% |
| Retaining wall | Decorative concrete block | +0.7% | +5.3% |
| Deck, fence, stair | Softwood lumber | -2.0% | +14.2% |
| None yet (sheathing) | Softwood veneer and plywood | +2.7% | +15.9% |
| Deck, fence | Treated wood | -0.6% | +3.5% |
| Drywall | Gypsum products | +0.8% | +1.4% |
| Paint | Architectural coatings | +0.5% | +2.4% |
| Roofing | Asphalt roofing and siding products | -2.0% | +2.7% |
| Tile | Clay floor and wall tile | 0.0% | +0.8% |
| Flooring | Resilient floor coverings / hardwood flooring | 0.0% / -0.1% | +1.3% / +2.5% |
| Mulch, topsoil | None |
Some of these pairings are approximate. Bagged concrete has no index of its own, so cement stands in for its main ingredient. The retaining wall row uses decorative concrete block because it’s the nearest index we found; BLS doesn’t break out retaining wall block. The rebar index also covers steel bar joists. We also searched the full BLS series list for mulch, bark, peat and topsoil. Nothing matched.
Every figure is from the index that isn’t seasonally adjusted; BLS publishes adjusted versions of some, and we didn’t use those. June through September are marked preliminary. The BLS series IDs, in table order, are WPU1333, WPU1322, WPU1074051, WPU1321, WPU133141, WPU133121, WPU0811, WPU0831, WPU087101, WPU137, WPU062101, WPU1361, WPU1344, WPU1232 and WPU081204. To check our reading of the files, we compared two rows with NAHB’s post: its softwood veneer and plywood (+2.7% in the month, +15.9% in the year) and diesel figures match ours.
Rebar has climbed in 8 of the last 9 months
The rebar index stood at 331.1 in December 2025 and 408.0 in September 2026. That’s 23.2% in nine months, and 13.9% above April’s 358.2. The only month it slipped was May, by less than 0.1%. September’s 4.9% jump was the biggest of the year. Steel mill products as a whole (WPU1017) were up 27.6% on the year, so rebar is moving with steel generally.
For a slab, that makes rebar the line on your shopping list most likely to be wrong if it came from a spring estimate. The concrete slab planner has optional price boxes for ready-mix, 80 lb bags, gravel by the ton, rebar by the stick, form boards and stakes. It assumes no prices, so type in what you’re quoted this week. If you’re only pricing the steel, the rebar calculator gives the stick count and weight to read out to the yard.
Ready-mix was flat in September. Cement was 1.2% lower than a year ago. If your concrete quote is from this summer, the steel is what we’d re-check first.
Lumber is up on the year but falling since July
Softwood lumber jumped 6.4% in July alone. Then it gave back 4.0% over August and September. That still leaves it 14.2% above September 2025. Plywood went the other way. It rose 2.7% in September and is up 15.9% on the year.
Treated wood rose only 3.5% in the year and fell 0.6% in September. We can’t tell you why it tracked so far below untreated softwood; the index doesn’t say. (If you’re unsure which treated rating a deck part needs, our post on ground contact vs above ground lumber splits the deck calculator’s example part by part.)
With untreated softwood swinging 6% in a month, an untreated framing lumber quote from midsummer may now be high, or still low. Get a fresh one. Treated deck boards fall under BLS’s separate treated wood index, which moved far less, but if your yard’s board price has changed, the deck calculator takes a price per board and multiplies it by the board count.
Delivery can rise faster than the stone
Construction sand, gravel and crushed stone rose 6.3% in a year and 0.2% in September. No. 2 diesel fuel (WPU057303) rose 24.2% in September and 115.2% in the year. The BLS release itself says 21.0% for the month; its monthly changes are seasonally adjusted.
BLS prices the stone and the diesel separately. A delivered load of gravel, topsoil or mulch pays for the material and the haul. NAHB’s same write-up puts transportation and warehousing services used in home building up 19.3% on the year. We don’t know how much of any one yard’s delivery fee is fuel. Ask for two lines. When you order bulk material, get the stone and the delivery priced separately, and you’ll see which one moved since your last order.
Why your receipt won’t match these percentages
BLS’s technical note describes the PPI as measuring the change in prices received by producers, seen from the seller’s side, and it leaves out taxes because they “do not represent producer revenue.” Since it’s the producer’s price, a store’s markup isn’t in it.
Our month figures aren’t seasonally adjusted, so some of a one-month move can be the normal time of year. And “All PPIs are subject to monthly revisions up to 4 months after original publication,” per the same note. September’s rebar jump isn’t final.
The September release puts the 12-month rise in final demand, BLS’s measure of producer prices overall, at 6.3% unadjusted. That’s the dashed line on the chart. The same release lists the October figures for November 13, 2026.